A fan curve is a graphical illustration of a fan’s performance and is usually generated through laboratory or field testing. It basically tells you exactly what the fan can do.
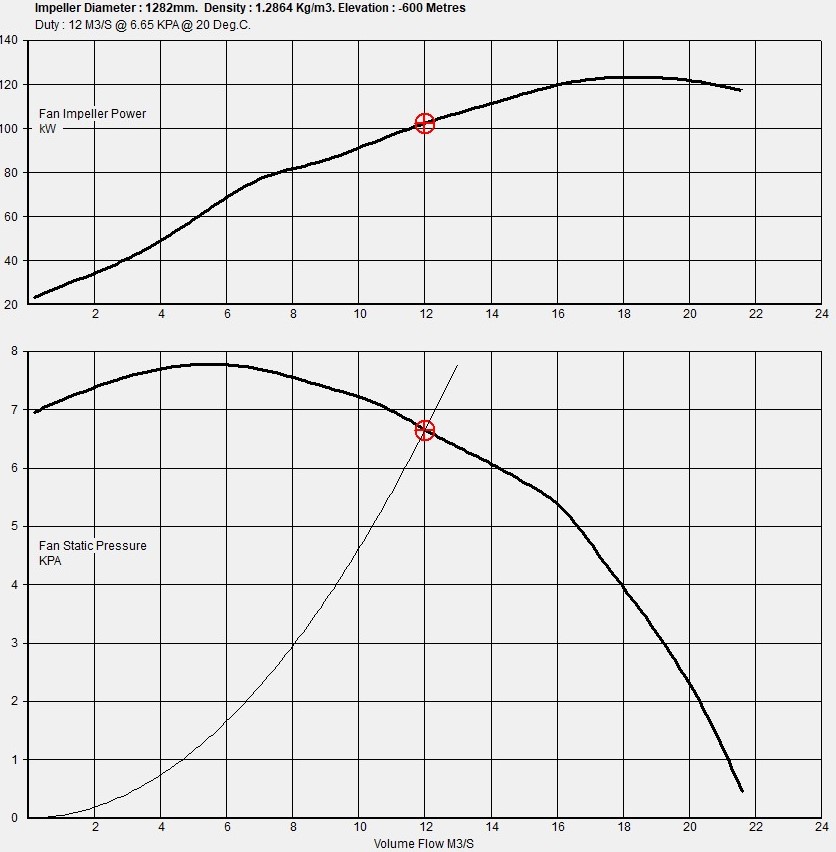
Like most general graphs, it consists of an x axis (horizontal) and a y axis (vertical). The vertical y axis shows the Static Pressure (kPa) of the fan in question whilst the horizontal x axis reads the Volume Flow (m³/s). It is also common to see Power (kW) plotted on a secondary vertical axis.
A parabolic curve generated from the zero axis is represented to reflect the system resistance curve and can be considered to be the sum of all pressure losses through the system the fan is connected to.
The intersection of the system resistance curve with the fan performance curve depicts the operation point of the fan. Where this operating point lands on the fan curve is critical. Straying too far from the stable region located approximately in the middle of the curve will produce undesirable results.
If you require assistance interpreting fan curve data, don’t hesitate to contact the AirEng After Sales team on +61 3 9738 1999.